Yin,L., Zhang,H., Li,X., Zhao,S. and Liu,X. (2022) hibayes: An R Package to Fit Individual-Level, Summary-Level and Single-Step Bayesian Regression Models for Genomic Prediction and Genome-Wide Association Studies. bioRxiv, 10.1101/2022.02.12.480230.
Analysis of genetic architecture and favorable allele usage of agronomic traits in a large collection of Chinese rice accessions. https://pubmed.ncbi.nlm.nih.gov/32303966/
User submitted samples
_static_gstool_task_TPP000210_demo_Rice_705Inbred
Sample
Calling SNP ratio
Rice1
94.85%
Rice2
98.49%
Rice3
96.28%
Rice4
97.86%
Rice5
96.06%
Rice6
95.72%
Note: * Calling SNP ratio: the ratio of the total number of SNPs in [ the sample mapped to the reference dataset ] / [ the total number of SNPs in the reference dataset ]
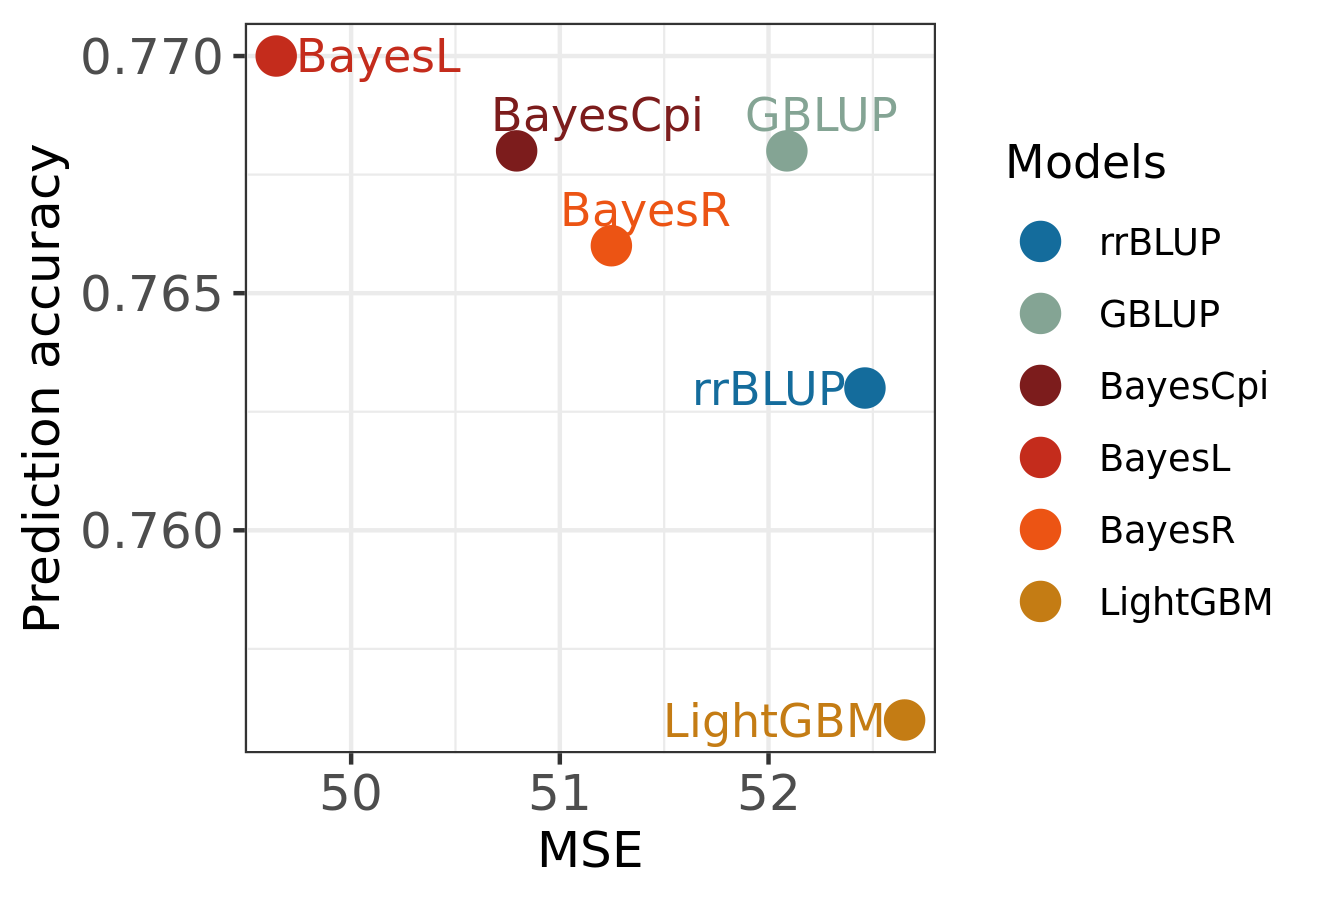
Plant Height (cm) -- Best Linear Unbiased Prediction
Models
Model
Prediction accuracy
MSE
RMSE
rrBLUP
0.763
52.46
7.14
GBLUP
0.768
52.09
7.13
BayesCpi
0.768
50.79
7.08
BayesL
0.770
49.64
7.00
BayesR
0.766
51.25
7.11
LightGBM
0.756
52.65
7.26
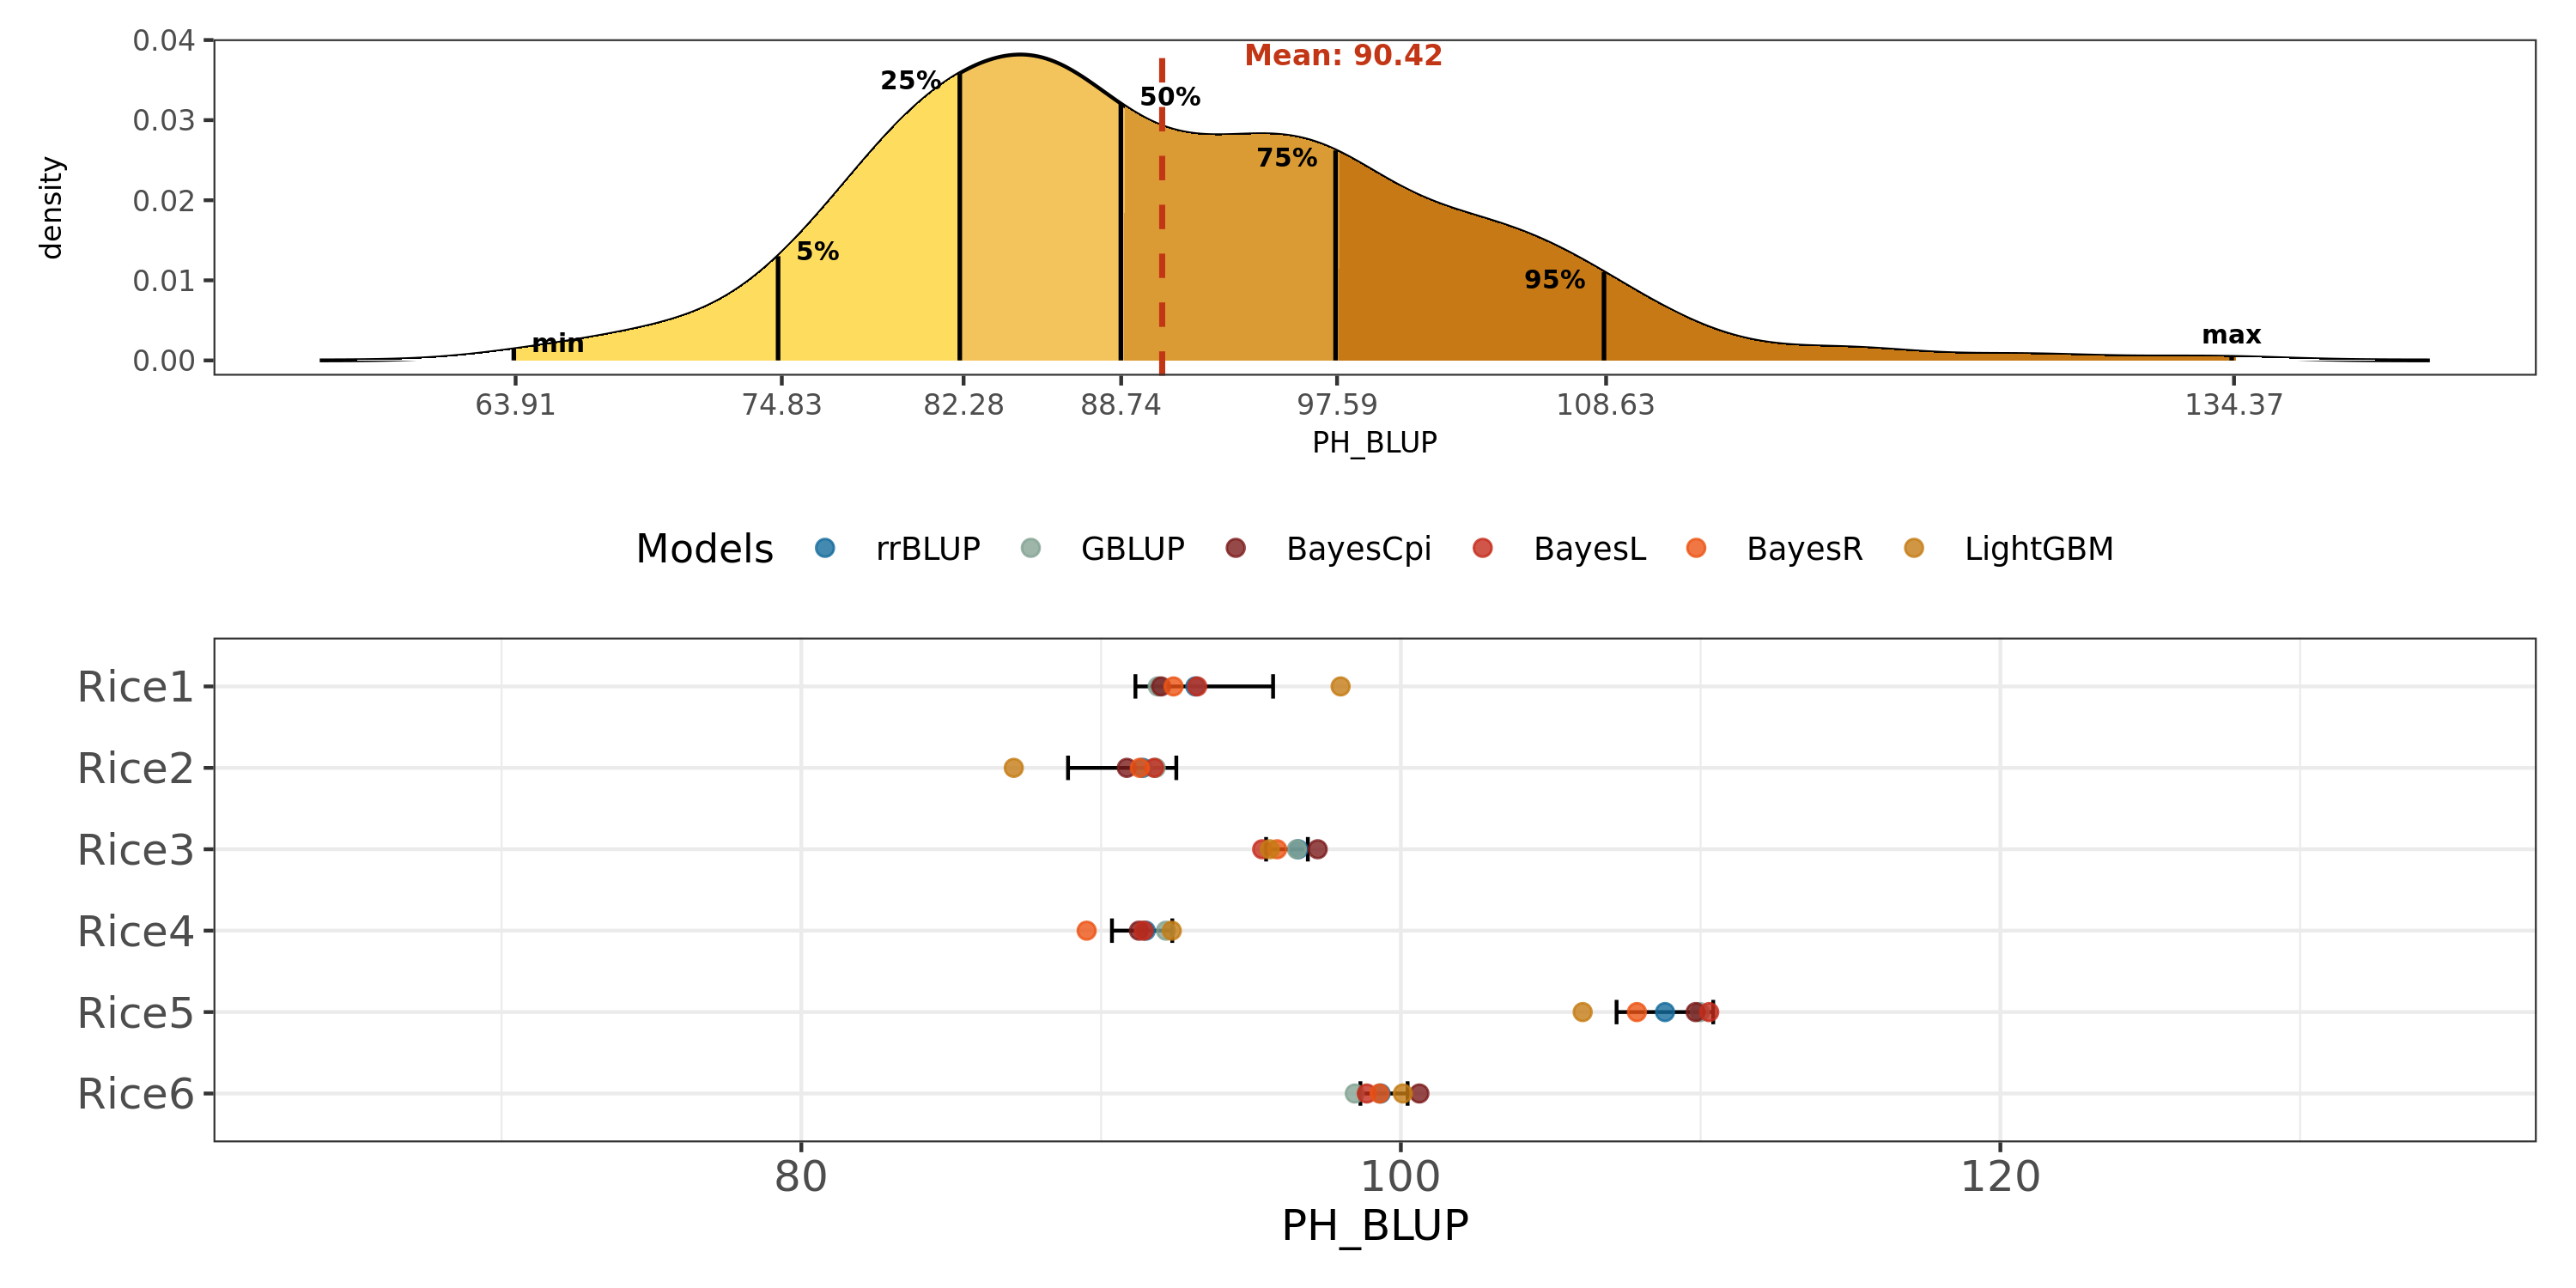
Prediction
Sample
rrBLUP
GBLUP
BayesCpi
BayesL
BayesR
LightGBM
Prediction
Pred/Max
Prediction
Pred/Max
Prediction
Pred/Max
Prediction
Pred/Max
Prediction
Pred/Max
Prediction
Pred/Max
Rice1
93.14
69.32%
91.89
68.38%
92.00
68.47%
93.21
69.36%
92.42
68.78%
97.99
72.92%
Rice2
91.39
68.01%
91.82
68.33%
90.86
67.62%
91.77
68.30%
91.29
67.94%
87.09
64.81%
Rice3
96.58
71.87%
96.53
71.84%
97.23
72.36%
95.37
70.98%
95.87
71.35%
95.63
71.17%
Rice4
91.49
68.09%
92.16
68.59%
91.26
67.92%
91.42
68.04%
89.52
66.62%
92.36
68.73%
Rice5
108.81
80.98%
109.98
81.85%
109.83
81.74%
110.29
82.08%
107.87
80.28%
106.07
78.93%
Rice6
99.33
73.92%
98.46
73.28%
100.62
74.88%
98.86
73.57%
99.29
73.89%
100.07
74.47%
LeadSNP
The lead SNPs for GWAS significant signals based on our CropGS-Hub GWAS database are also listed below for users who are interested in traditional marker-assisted selection (MAS)
SNPid
Chromosome
Position
Ref
Alt
P value
Genetic Effect (Alt - Ref)
Chr1_22261818
Chr1
22261818
T
C
6.9007e-07
2.2805
Chr1_24388159
Chr1
24388159
T
A
7.9088e-07
3.6184
Chr1_32879690
Chr1
32879690
G
A
6.0629e-08
5.9446
Chr1_33071815
Chr1
33071815
T
G
1.1346e-07
4.4474
Chr1_40399153
Chr1
40399153
G
T
1.2742e-06
3.9945
Chr2_7378326
Chr2
7378326
T
G
7.6800e-08
-4.1843
Chr2_29822260
Chr2
29822260
G
C
5.3157e-08
4.4923
Chr4_19373249
Chr4
19373249
T
C
2.6256e-07
3.4109
Chr6_10837867
Chr6
10837867
A
C
1.4117e-06
2.8994
Chr6_14068241
Chr6
14068241
A
G
6.6725e-07
-3.2908
Chr6_16023180
Chr6
16023180
C
T
8.5371e-07
-3.1884
Chr6_24817517
Chr6
24817517
T
C
7.9473e-07
4.0076
Chr7_10992926
Chr7
10992926
C
A
1.0543e-06
-5.6017
Chr8_14483606
Chr8
14483606
T
C
1.1864e-06
7.6625
Chr9_993867
Chr9
993867
A
G
1.2481e-06
5.1024
Chr9_4307285
Chr9
4307285
C
T
6.3062e-07
5.4491
Chr9_6905151
Chr9
6905151
T
C
7.3720e-08
4.5672
Chr9_15967723
Chr9
15967723
T
C
4.7518e-08
5.3430
Chr10_18175505
Chr10
18175505
A
G
1.3933e-07
6.5712
Chr12_27253752
Chr12
27253752
C
G
5.7311e-08
2.3405
Lead SNPs in this database have been idefined using PLINK. The parameters are set as follows: --clump-p1 $cutt-off --clump-p2 0.05 --clump-r2 0.1 --clump-kb 1000