Yin,L., Zhang,H., Li,X., Zhao,S. and Liu,X. (2022) hibayes: An R Package to Fit Individual-Level, Summary-Level and Single-Step Bayesian Regression Models for Genomic Prediction and Genome-Wide Association Studies. bioRxiv, 10.1101/2022.02.12.480230.
Note: * Calling SNP ratio: the ratio of the total number of SNPs in [ the sample mapped to the reference dataset ] / [ the total number of SNPs in the reference dataset ]
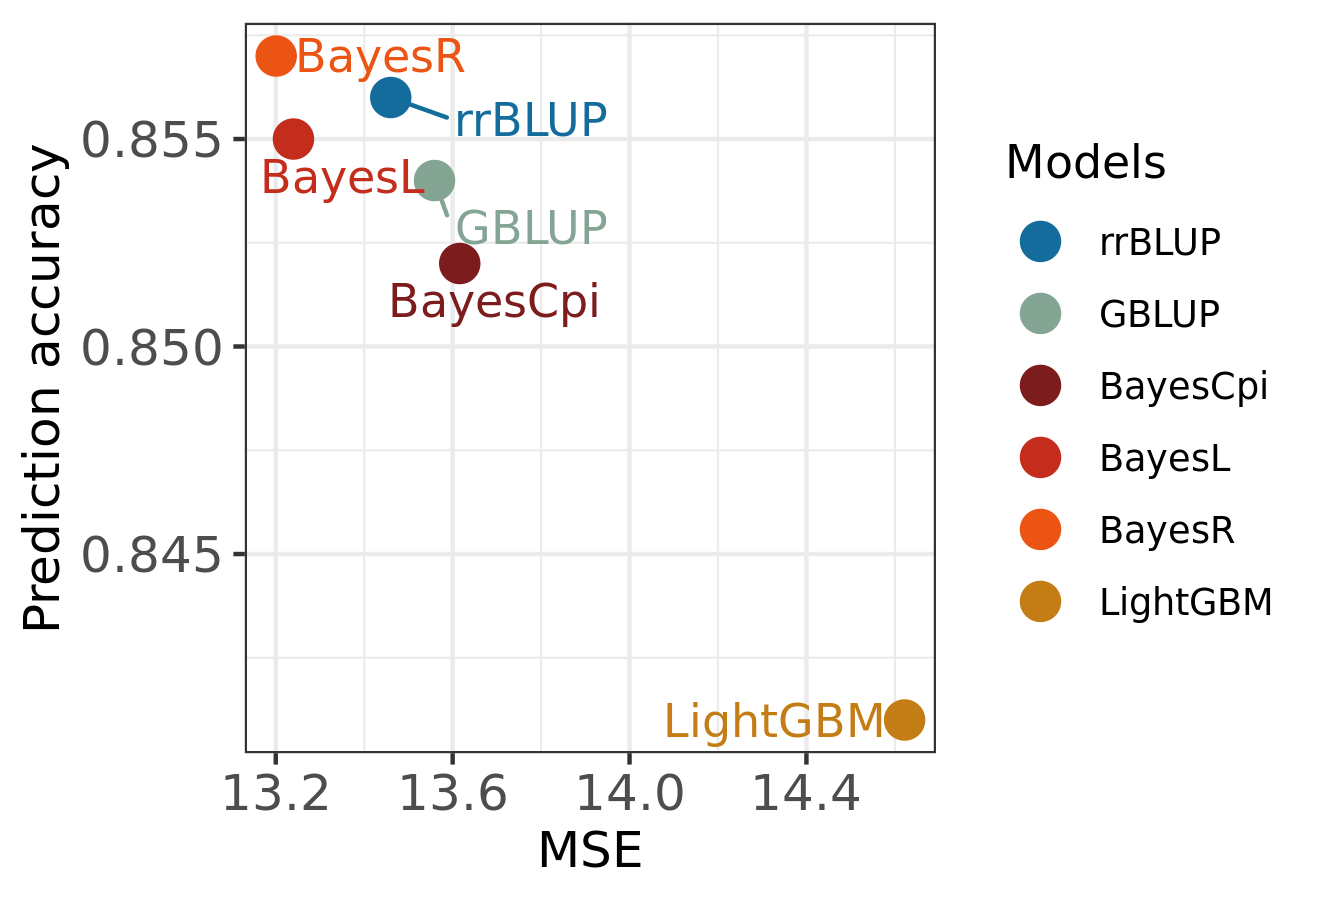
Height (cm) -- Best Linear Unbiased Prediction
Models
Model
Prediction accuracy
MSE
RMSE
rrBLUP
0.856
13.46
3.65
GBLUP
0.854
13.56
3.67
BayesCpi
0.852
13.62
3.69
BayesL
0.855
13.24
3.63
BayesR
0.857
13.20
3.62
LightGBM
0.841
14.62
3.82
Prediction
Sample
rrBLUP
GBLUP
BayesCpi
BayesL
BayesR
LightGBM
Prediction
Pred/Max
Prediction
Pred/Max
Prediction
Pred/Max
Prediction
Pred/Max
Prediction
Pred/Max
Prediction
Pred/Max
Line1_XXX_Line2
93.78
76.51%
94.34
76.96%
94.45
77.06%
93.59
76.35%
93.13
75.98%
98.14
80.07%
Line1_XXX_Line3
93.08
75.94%
95.02
77.52%
93.46
76.25%
94.40
77.01%
93.47
76.26%
97.22
79.31%
Line1_XXX_Line4
94.82
77.36%
94.95
77.46%
95.72
78.09%
95.47
77.89%
94.89
77.41%
99.06
80.82%
Line1_XXX_Line5
96.65
78.85%
95.72
78.09%
98.66
80.49%
97.14
79.25%
94.72
77.28%
99.36
81.06%
Line1_XXX_Line6
95.04
77.54%
94.41
77.02%
95.76
78.12%
95.68
78.06%
93.88
76.59%
98.52
80.38%
Line2_XXX_Line3
95.35
77.79%
96.54
78.76%
95.18
77.65%
95.98
78.30%
96.52
78.74%
96.23
78.51%
Line2_XXX_Line4
96.11
78.41%
96.63
78.83%
97.04
79.17%
96.58
78.80%
97.78
79.77%
98.14
80.06%
Line2_XXX_Line5
96.16
78.45%
96.07
78.38%
97.49
79.54%
96.59
78.80%
95.34
77.78%
99.47
81.15%
Line2_XXX_Line6
97.47
79.52%
97.24
79.33%
97.05
79.18%
97.25
79.34%
97.05
79.18%
96.51
78.73%
Line3_XXX_Line4
95.60
77.99%
98.54
80.40%
95.61
78.00%
97.61
79.63%
98.17
80.09%
97.20
79.30%
Line3_XXX_Line5
96.88
79.04%
97.34
79.41%
98.08
80.01%
98.87
80.66%
97.25
79.34%
96.55
78.77%
Line3_XXX_Line6
97.56
79.59%
99.06
80.82%
97.22
79.31%
99.54
81.21%
98.21
80.12%
98.54
80.39%
Line4_XXX_Line5
97.76
79.75%
97.33
79.41%
98.48
80.34%
98.82
80.62%
97.65
79.67%
99.14
80.88%
Line4_XXX_Line6
98.06
80.00%
99.09
80.84%
99.02
80.78%
99.61
81.26%
99.00
80.77%
97.89
79.86%
Line5_XXX_Line6
98.51
80.37%
97.83
79.82%
100.28
81.81%
99.82
81.43%
97.44
79.50%
97.62
79.64%
LeadSNP
The lead SNPs for GWAS significant signals based on our CropGS-Hub GWAS database are also listed below for users who are interested in traditional marker-assisted selection (MAS)
SNPid
Chromosome
Position
Ref
Alt
P value
Genetic Effect (Alt - Ref)
Chr1_5088861
Chr1
5088861
C
T
6.1509e-06
-2.4658
Chr2_15070264
Chr2
15070264
G
A
6.6595e-08
3.0146
Chr3_1254972
Chr3
1254972
A
G
1.9089e-09
2.8958
Chr4_25115617
Chr4
25115617
G
T
5.3960e-06
-0.6773
Chr6_2899259
Chr6
2899259
C
G
1.8111e-06
2.4843
Chr8_4670027
Chr8
4670027
G
A
6.4227e-06
-2.7599
Chr8_6101818
Chr8
6101818
T
C
8.6624e-09
3.9511
Chr8_28059937
Chr8
28059937
T
C
2.4897e-07
-1.8969
Chr12_23352645
Chr12
23352645
T
G
5.9812e-06
-2.2893
Lead SNPs in this database have been idefined using PLINK. The parameters are set as follows: --clump-p1 $cutt-off --clump-p2 0.05 --clump-r2 0.1 --clump-kb 1000